September 29, 2026
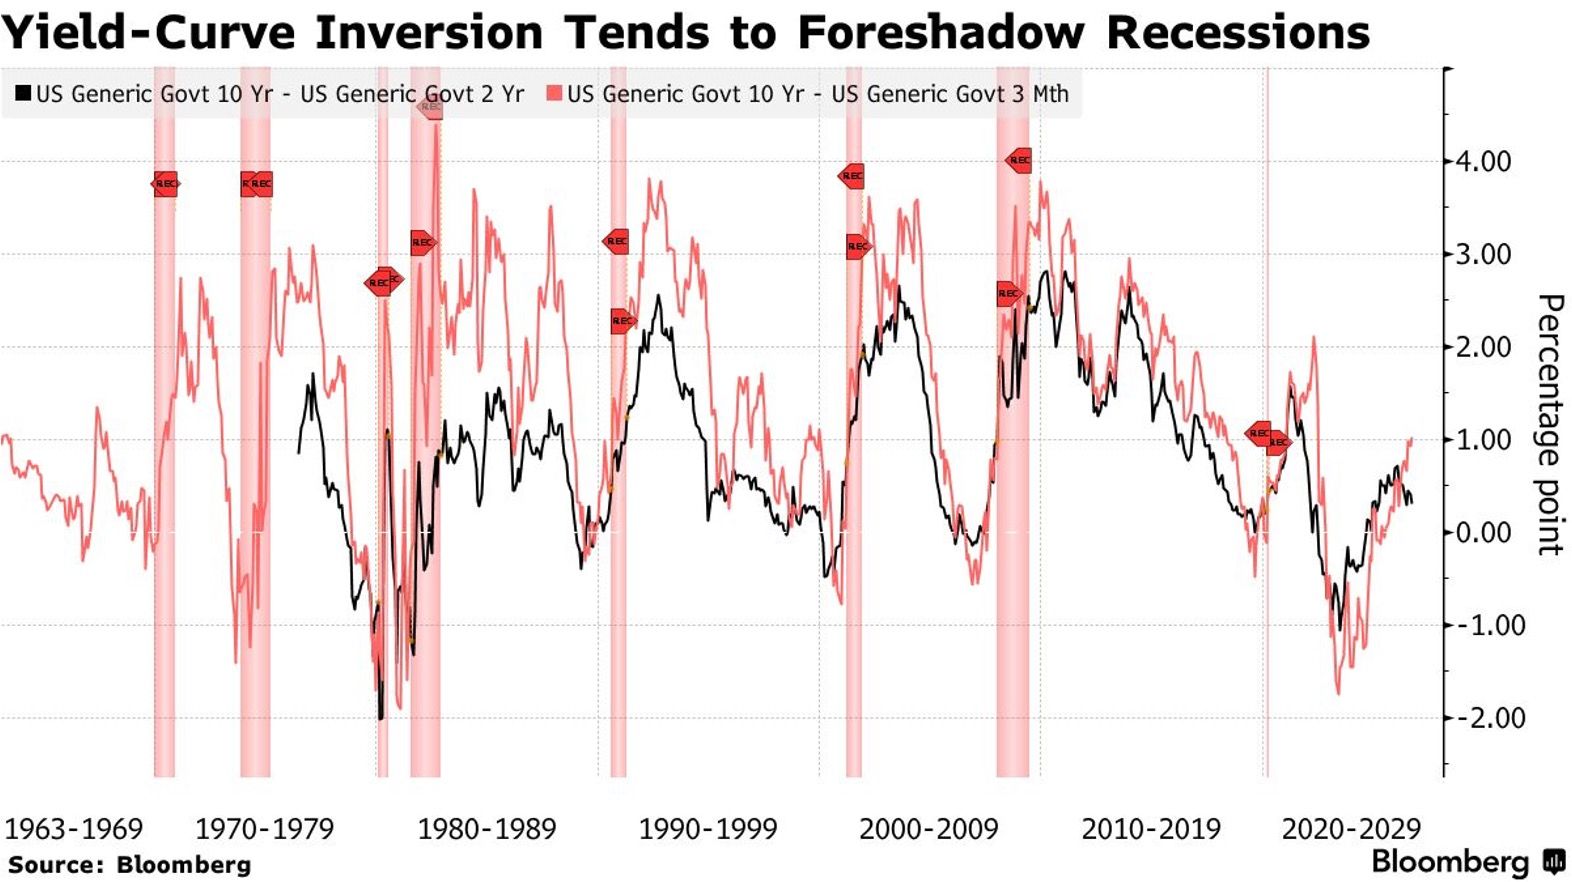
In the United States, the gap between the 2-year yield (4.93%) and the 10-year yield (5.25%) has narrowed to 31 basis points. This compression of the yield curve revives recession fears, but the analysis deserves to go beyond the 2-year–10-year segment alone. The reality of the bond market in 2026 is more nuanced: several opposing forces are blurring the traditional signals.
The mechanism is well known. When the central bank raises its policy rates to fight inflation, short-term yields rise quickly. If, at the same time, investors expect this monetary tightening to be followed by rate cuts in response to an economic slowdown, long-term yields stagnate or fall. The inverted crossing of the curves then signals that the restrictive cycle could weaken activity.
Credit becomes more expensive for companies and households, reducing demand. This historical sequence has often preceded recessions. However, this indicator only works if the conditions that validated it in the past remain unchanged.
High oil prices and the expectation of further policy rate hikes are pushing short-term (2-year) yields to significant levels. These two factors reflect an economic reality: inflation remains a concern, and the Federal Reserve must maintain a restrictive stance.
At the same time, three elements are keeping 10-year yields at high levels: persistent inflation fears, the growing weight of US public debt, and general macroeconomic uncertainty. Investors demand substantial compensation to lend over ten years, even if they expect lower short-term rates in the years ahead.
This demand for yield is explained by perceived risk and not solely by the path of future rates. In other words, the observed flattening results from two opposing movements fighting each other, rather than a pure inversion caused by the anticipation of a recession.
The gap between the 3-month yield and the 10-year yield remains positive at +108 basis points. Historically, this indicator offers a more robust signal of recession risk than the 2-year–10-year spread alone. It reflects a broader view of rate expectations and can reveal a real inversion of the monetary cycle.
In 2022, the yield curve did indeed invert, producing a classic warning signal. Yet the expected economic recession did not materialise on the same scale or with the same timing as predicted by historical analyses. Several shock absorbers came into play: the refinancing of older debt at fixed rates, sustained fiscal support, and the resilience of household consumption.
This episode is a reminder that the yield curve, even when inverted, is not a verdict. It remains one indicator among others and its predictive power depends on the context.
The dilemma facing the Federal Reserve in 2026 is particular. On the one hand, it must contain inflation, fuelled by supply shocks (energy prices). On the other, it must not curb demand excessively, at the risk of tipping the economy into recession.
If employment remains firm and credit available, the flattening of the curve would mainly reflect the need to keep rates restrictive to control prices. Conversely, if employment deteriorates and credit contracts while markets anticipate rapid policy rate cuts, the warning on growth would become more credible.
A robust approach consists of examining several segments simultaneously: 3-month–2-year, 2-year–10-year and 3-month–10-year. None is a panacea. Combining this reading with employment data, consumer and business confidence surveys, and credit conditions offers a more complete picture than the curve alone.
The yield curve remains a valuable tool in 2026, provided it is read correctly. A flattening or an inversion is not enough to conclude that a recession is imminent. The economic context—inflation, oil shocks, monetary policy—must be taken into account in any serious analysis.
Astute investors and decision-makers do not rely solely on the slope of a curve, but on a holistic examination of macroeconomic conditions, market expectations and real cycle data.
This is not investment advice.